
TTR FAQ
INRstar calculates TTR both for an individual patient, and can also work out an average TTR for your whole anticoagulation service. Below are some questions that regularly come up around TTR.
For more detail on each of the individual TTR reports, see the Related Content links on the right hand side of the page.
For more on what TTR is and how it compares to Point Prevelance, see " TTR and Point Prevalence - Making Sense of Anticoagulation Control" on the right hand side.
You may adjust the TTR ranges that patients are grouped into, by changing the TTR Band Upper Limit parameters at the top of the page, this enables you to report on any banding structure you prefer, so long as there are 7 bands.
The Upper Limit for one band, becomes the Lower Limit for the next band up. For example, by default bands 1, 2 and 3 are:
1) 0 – 40% TTR
2) 40 – 50% TTR
3) 50 – 60% TTR
40% is the Upper Limit of band 1, and hence also the Lower Limit of band 2. If you change the TTR Band 1 Upper Limit to 30%, then the Lower Limit of band 2 will automatically drop to 30%, and the bands will change like this:
1) 0 – 30% TTR
2) 30 – 50% TTR
3) 50 – 60% TTR
Note that a patient with a TTR of exactly 50.00% would be shown in the 30-50% TTR band, and a patient with a TTR of 50.01% for example, would be shown in the 50 – 60% band.
However TTR percentages are rounded to 1 decimal place, so whilst both those patients would show a TTR of 50% on the report, they are correctly grouped into different bands.
This is why if you look at patients in their bands, you may see some patients showing 50% TTR grouped into band 2, and some patients showing 50% TTR grouped into band 3. Really their TTRs might be something like 49.96% and 50.03% for example, but the report display rounds them to 50%.
The report shows sub-totals of active patients for each band, and a grand total at the bottom.
You may further filter the list of patients by:
· Selecting their Testing Location (if you have permission to report on more than one)
· Selecting specific diagnoses, rather than the default of All Diagnoses
· Selecting patients identified by the group: Complex, Home Visit, INR Self Testing or requiring Transport, or leaving it at the default of (unfiltered) to list patients of all groups.
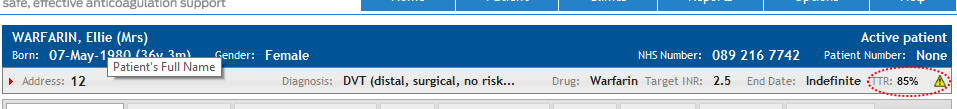
The 12 month TTR for an individual patient can be found on the patient’s summary banner:

INRstar provides a location or service level TTR. This can be thought of as an average TTR for all the patients in your anticoagulation service and is useful for assessing how well your anticoagulation service is controlling your patients.
Note: A location's TTR is not the mean average of all the individual patient
TTRs at a location, it is the (number of days in range)/(number of days in
treatment) for all patients that were tested by that location. This figure is statistically more accurate.
INRstar provides several reports that show service level TTRs:
If you are after a single TTR figure for your service:
- Warfarin Quality Metrics (NPSA Audit) - shows the 12 month TTR or All Time TTR figure for your location
- TTR Trend Over Time - shows whether your TTR is improving over time
If you need the % of patients in a TTR band, e.g xx% of patients have TTRs of > 65%:
- Rolling 12 Month TTR - puts all of your patients into TTR buckets, e.g. 70% of your patients had TTRs of more than 65% - worked out from their tests over the previous 12 months.
- All Time TTR - the same as the above Rolling 12 Month report, but TTRs are calculated from all their tests in INRstar - ever.
- Patients by TTR Band - enables you to identify individual patients in each TTR band, e.g. who has a TTR of less than 65%.
Note: An individual patient cannot appear more than once in the Patients by TTR Band report, as only a patients latest, active treatment plan is used. A patient may appear more than once in the other banded reports, as they may have had more than one treatment episode during the time period.
If you would like a single figure for your locations TTR for the last quarter or month run the Warfarin Quality Metrics (NPSA Audit) report for the date range you are interested in.
- The "Location - 12 Month TTR" figure is the TTR for your location, based on all INR tests over the last 12 months prior to the end date in the date range selected.
- The "Location - All Time TTR" figure is the TTR for your location, based on all INR tests at your location, ever, prior to the end date in the date range selected.
If this figure is required for CCG Audit purposes we recommend using the 12 Month TTR figure, as this gives a more accurate reflection of the recent performance of a service.
If you need the % of patients in a TTR band, e.g xx% of patients have TTRs of > 65%:
- Rolling 12 Month TTR - puts all of your patients into TTR buckets, e.g. 70% of your patients had TTRs of more than 65% - worked out from their tests over the previous 12 months prior to the month selected.
The TTR
calculation estimates the number of days a patient was in range over the whole course of
their treatment and extrapolates INR values daily, based on the INR readings
known about.
The NICE guidance recommends calculating TTR over at least 6 months. TTR is a measure of anticoagulation control over a reasonable period time, during which a patient has had several INR tests. Calculating TTR over a single month is not helpful, as a patient may not have had an INR test in that period. It is for this reason that INRstar, in line with NICE guidance, calculates TTR over a 12 month period, or over "All Time" (i.e. using all INR results we have).
Note: An individual patient cannot appear more than once in the Patients by TTR Band report, as only a patients latest, active treatment plan is used. A patient may appear more than once in the other banded reports, as they may have had more than one treatment episode during the time period.
Yes – INRstar complies with the 2014 NICE guidance on TTR calculations:
"use a validated method of measurement such as the Rosendaal method for computer-assisted dosing or proportion of tests in range for manual dosing" - INRstar uses the Rosendaal method
"exclude measurements taken during the first 6 weeks of treatment" - INRstar excludes the first 6 weeks of tests and tests flagged as initiation tests.
"calculate TTR
over a maintenance period of at least 6 months" – INRstar alerts you
with a warning triangle if less than 6 months of tests are available.
The 2014 Atrial Fibrillation NICE guidance recommends that anticoagulation is reassessed for AF patients whose TTR is < 65%.
To get a list of these patients go to Reports and run the "Individual Patient TTRs" report. This report splits patients into groups by their TTR.