
Completed Warfarin Treatments - Overview
This report breaks down numbers and types of warfarin treatments carried out over a date range in various ways.
Use this report to:
- Retrieve warfarin treatment statistics for payment purposes
- Get the number of patients treated
- Get the number of patients newly induced
- Get numbers of INRs that were more than 0.5, 0.75 or 1 units outside of target (INR variance)
- Get numbers of self tests, home visits done and complex patients treated
- Get a breakdown of numbers by registered practice - useful if you test on patients on behalf of other practices
Note that the report can be additionally filtered by*:
- Registered Practice
- Include Historical Treatments
The "Treatment Totals by Registered Practice" table at the bottom of the report breaks down the treatments done by registered practice. This breakdown may be useful for locations who test patients on behalf of other practices and who need to report back to those practices on patients treated. The 'Registered Practice' field in the 'Patient Management' tab needs to be set correctly for these figures to be accurate.
Please look under 'Additional files' on the right-hand side of this page to view or download an example report.
*See Report Section Definitions below.
Patients Treated
• Total Patients Treated – this provides a count of all patients treated within the specified date range regardless of how often they have been treated.
• Patients Newly Initiated – this provides a count of all patients who have had a first induction treatment (Oates, Tait or Manual) within a treatment plan within the specified date range. N.B. If a patient has been initiated twice (i.e. 2 treatment plans containing induction treatments) within the specified date range then they will be counted twice.
• Complex Patients Treated – this provides a count of all patients, who are marked as ‘complex’ that have been treated within the specified date range regardless of how often they have been treated.
INR Variance
• Within 1 units of target INR – this provides the total number of treatments (in brackets) and what percentage this is of all treatments reported on that are up to and within 1 unit of a patient’s target INR.
• Within 0.75 units of target INR – this provides the total number of treatments (in brackets) and what percentage this is of all treatments reported on that are up to and within 1 unit of a patient’s target INR.
• Within 0.5 units of target INR – this provides the total number of treatments (in brackets) and what percentage this is of all treatments reported on that are up to and within 1 unit of a patient’s target INR.
It should be noted that the treatments within the 0.5 unit band will also be within the 0.75 unit band and the 1 unit band.
Test Types & Treatment Types
• Counts of individual treatments marked as POCT, LAB, Home Visit along with what Dosing Method was employed (Oates, Tait, Coventry, Hillingdon etc.)
• A total number of treatments recorded within the date range specified is provided within the Treatment Types section.
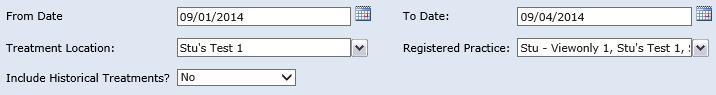
Note that the report can be additionally filtered by:
• Registered Practice – this lists all practices whose patients you treat, you can thus limit the report to show only the treatments done for patients of a specific practice if necessary. At the foot of the report the practice data included is summarised in an additional table.
• Include Historical Treatments – By default treatments recorded as historical are not in the report. Historical treatments can be by use of this filter. Selecting this will affect almost all of the data in the report.
The default date range for this report is the last 3 months. This can be altered by setting the From Date and To Date filters.
Running the Report
Click 
Under ![]() click on the report title
click on the report title ![]()
Next select the details you wish the report to show.
Now click ![]() to see your report below.
to see your report below.
After the report has generated you can order the data by specific column by clicking the ![]() button next to the column title.
button next to the column title.
Exporting and Printing the Report
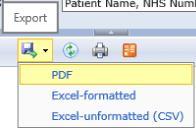
To export the report click the icon above. There are three ways to export a report:
- PDF - exports the report data to a PDF file (see Example Completed Warfarin Treatments - Detailed List Report in Additional files to the top right of this screen for an example)
- Excel-formatted - exports the report into Excel in the same format viewed on the report page
- Excel-unformatted (CSV) - exports the report into Excel as raw data
You can print the report by clicking ![]() in the report page or in Excel or Adobe Reader after exporting the and opening the report.
in the report page or in Excel or Adobe Reader after exporting the and opening the report.