
Completed Warfarin Treatments (Patients Tested Elsewhere) - Detailed List
This report gives a detailed list of the number and type of warfarin treatments carried out on your registered patients over a date range. Users can tailor the report to meet their individual needs by selecting the columns they wish to show and by using the filters.
Examples uses for this report:
• Get a list of patients who have had high or low INRs
• See who has had a home visit last month
• Get a list of INRs that were more than 0.5, 0.75 or 1 units outside of target (INR variance)
• Get a list of INRs that were more than one unit below target
• Get a list of INRs that were self tested last month
• Get a list of all treatments done on a day by a particular user
For example, a practice may provide an a/c service, but still have a few patients whose anticoagulation is managed by another location. This report allows their treatments to be viewed by their registered practice, provided the "Registered Practice" field is set up correctly on the Care Team tab by the testing location.
Alternatively 'View Only' locations can use this report to view treatment details for patients registered with them.
The treatments shown can be filtered by the following settings:
- Report to - Include treatments up to and including this date. This is based on the treatment date, not when the treatment was entered into the system.
- Report From - Include treatments done on and since this date. This is based on the treatment date, not when the treatment was entered into the system.
- Testing location - The testing location(s) the user has access to.
- Registered practice - If you test patients on behalf of other registered practices than this is a list of all registered practices set up for your patients.
- Show INRs Above
- filter the report by INRs greater than the value entered here. For example, to get a list of INRs greater than 5 enter 4.9 here.
- Show INR Below - filter the report by INRs less than the value entered here. For example, to get a list of INRs less than 1.5 enter 1.6 here.
- Include historical treatments – Add or remove historical treatments from the report.
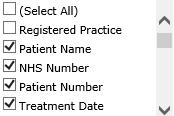
- Select columns to show – select the columns you want to be returned by the report.
Below is a description of each column:
- Registered Practice – Where the patient is currently registered
- Patient Name – Patient name
- NHS Number - NHS Number
- Patient Number - Patient Number
- Treatment Date – The date the treatment was done
- Diagnosis – The diagnosis at the time of treatment
- Daily Dose – Dose the patient was on at the time of treatment
- Actual INR – The INR reading for that treatment
- Target INR – The target at time of the treatment - this may be different to the current treatment plan target
- Next Test Date – The NTD at time of treatment
- User – The user that recorded the INR in the system
- Induction Treatment – This will be "Yes" if the "Induction" checkbox was selected when the INR was entered
- Home Visit Treatment – This will be "Yes" if the "Home visit" checkbox was selected when the INR was entered
- Batch Number – PoCT batch number for the treatment
- Complex Patient – This will be "Yes" if the patient is in the complex patient group
- Date of Birth – Patient Date of Birth
- Dosing Method – Dosing method used at the time of treatment
- Historical Treatment – This will be "Yes" if this treatment was entered as a historical treatment (not using the New INR button)
- Low INR 1 Unit Below Target – This will be "Yes" if this INR was more than 1 unit below the target INR
- Phone – Patient's primary telephone number
- Self Test Treatment – This will be "Yes" if the "Home visit" checkbox was selected when the INR was entered
- Testing Method of Treatment - The testing method used for that treatment
- Transport Group Patient – This will be "Yes" if the patient is in the "Requires Transport" patient group
- INR Result Within 1 Unit of Target – This will be "Yes" if the INR was 1 unit or more away from the target INR
- INR Result Within 0.75 Unit of Target – This will be "Yes" if the INR was 0.75 unit or more away from the target INR
- INR Result Within 0.5 Unit of Target – This will be "Yes" if the INR was 0.5 unit or more away from the target INR
Running the Report
Click 
Under ![]() click on the report title
click on the report title ![]()
Next select the details you wish the report to show.

PLEASE NOTE: Select Columns to Show will give you 26 different potential items to add to the columns of the report so be sure to place a tick next to any column you want from the drop down list (see the definitions in the Columns Definitions drop-down below).

Now click ![]() to see your report below.
to see your report below.
After the report has generated you can order the data by specific column by clicking the ![]() button next to the column title.
button next to the column title.
Exporting and Printing the Report
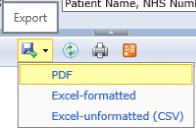
To export the report click the icon above. There are three ways to export a report:
- PDF - exports the report data to a PDF file (see Example Completed Warfarin Treatments - Detailed List Report in Additional files to the top right of this screen for an example)
- Excel-formatted - exports the report into Excel in the same format viewed on the report page
- Excel-unformatted (CSV) - exports the report into Excel as raw data
You can print the report by clicking ![]() in the report page or in Excel or Adobe Reader after exporting the and opening the report.
in the report page or in Excel or Adobe Reader after exporting the and opening the report.
- To get a list of patients who have had high INRs, set the "Show INRs Above" filter to your threshold value and run the report. Leave the Show INRs Below filter to 99. The thresholds are not inclusive, so for example, to get INRs of 5 or above, set the "Show INRs Above" filter to 4.9.
- To get a list of patients who have had low INRs, set the "Show INRs Below" filter to your threshold value and run the report. Leave the Show INRs Above filter to 0. The thresholds are not inclusive, so for example, to get INRs of 2 or below, set the "Show INRs Below" filter to 2.1.
Please note you cannot get a list of high and low INRs in the same report, you can only get separate lists by running the report twice, with differing filters.
- Set the date range you wish to get a list of home visits carried out over by setting the "From Date:" and "To Date:" filters.
- Expand the "Select Columns to Show" filter by dragging on the bottom right corner.
- Ensure that Patient Name and Home Visit Treatment are selected, along with any other information, for example, Registered Practice, that you need.
- Run the report.
- Click on the arrows in the Home Visit Treatment column heading to bring a list of home visits to the top. If the 'Home Visit' checkbox was ticked when the INR was entered, there will be a Yes in this column.
- If you wish to, you could export the list to Excel and remove treatments that were not home visits from the list.
- Set the date range by setting the "From Date:" and "To Date:" filters.
- Expand the "Select Columns to Show" filter by dragging on the bottom right corner.
- Ensure that one of the columns "INR Result Within 0.5 Unit of Target", "INR Result Within 0.75 Unit of Target", "INR Result Within 1 Unit of Target", or all of the above are selected, along with any other information, for example, Patient Name, that you need.
- Run the report.
- Click on the arrows in the relevant column heading to bring all the "No" answers to the top. For example, a 'No' on the "INR Result Within 1 Unit of Target" indicates that that INR was out of range by more than 1 unit.
- Export the results to Excel to do further analysis if needed.
- Set the date range by setting the "From Date:" and "To Date:" filters.
- Expand the "Select Columns to Show" filter by dragging on the bottom right corner.
- Ensure that the "Low INRs - 1 Unit Below Target" is selected, along with any other information, for example, Patient Name, that you need.
- Run the report.
- Click on the arrows in the "Low INRs - 1 Unit Below Target" column heading to bring a list of INRs more than one unit below their target to the top. A "Yes" in this column indicates that the result was more than 1 unit below target.
- Set the date range by setting the "From Date:" and "To Date:" filters.
- Expand the "Select Columns to Show" filter by dragging on the bottom right corner.
- Ensure that the "Self Tests" column is selected, along with any other information, for example, Patient Name, that you need.
- Run the report.
- Click on the arrows in the "Self Tests" column heading to bring a list of self tests to the top. If the 'Self Tests' checkbox was ticked when the INR was entered, there will be a Yes in this column.
- Set the date range by setting the "From Date:" and "To Date:" filters.
- Expand the "Select Columns to Show" filter by dragging on the bottom right corner.
- Ensure that "User" is selected, along with any other information that you need.
- Run the report.
- Click on the arrows in the "User" column heading to sort treatments by user.
- Set the date range by setting the "From Date:" and "To Date:" filters.
- Expand the "Registered Practice" filter by dragging on the bottom right corner.
- Ensure that the registered practices you want to show treatments for are selected.
- Expand the "Select Columns to Show" filter by dragging on the bottom right corner and select "Registered Practice".
- Run the report.
- Click on the arrows in the "Registered Practice" column heading to group treatments by practice.